 Explore report
Interactive report
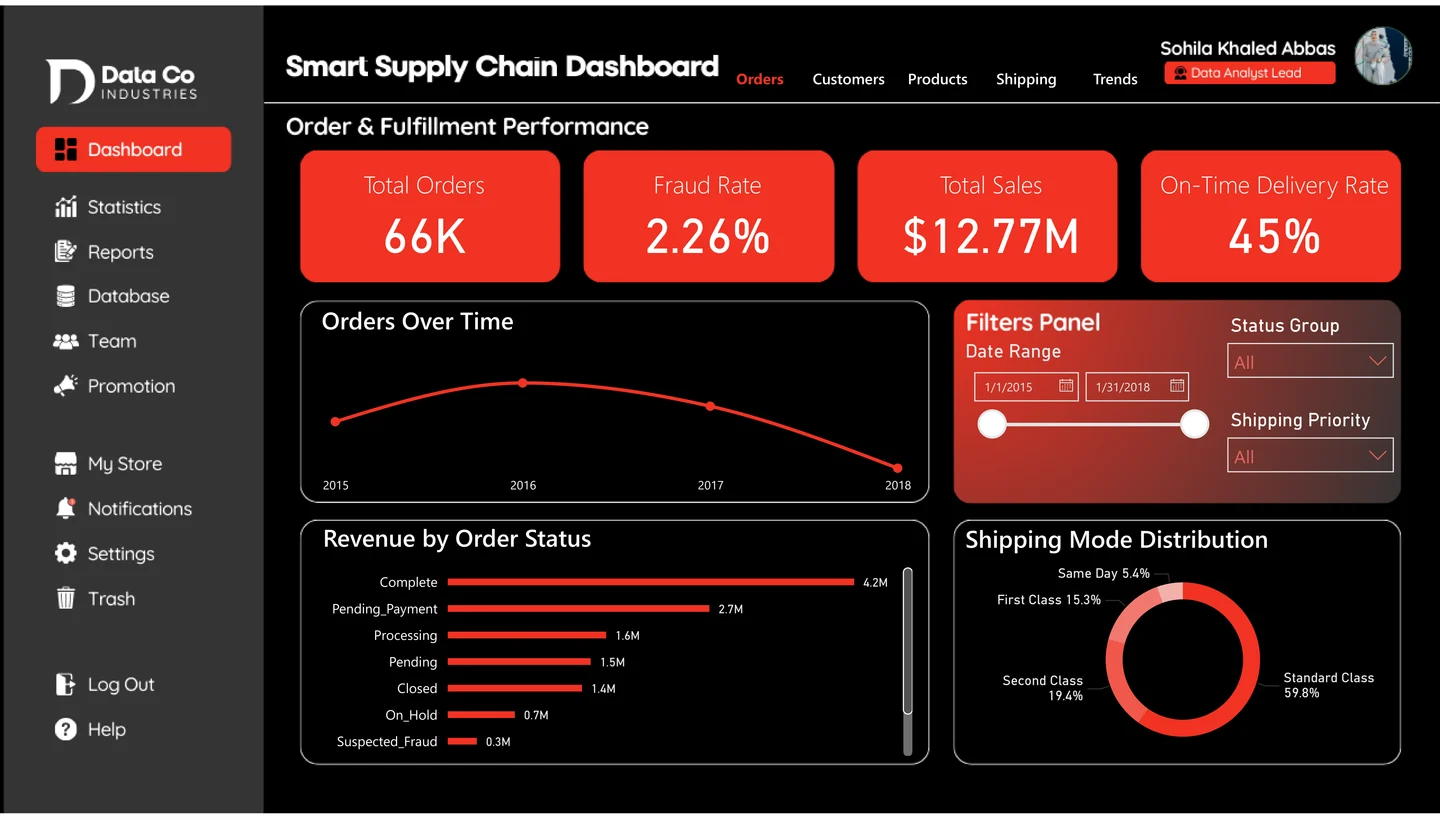
Smart Supply Chain
Order fulfillment, customer insights, product profitability, and shipping performance.
Power BI reports, repository screenshots, and the project files behind them. Choose a report to explore its preview, source, and available dashboard link.
22 reporting projects
Explore report Order fulfillment, customer insights, product profitability, and shipping performance.
 Explore report
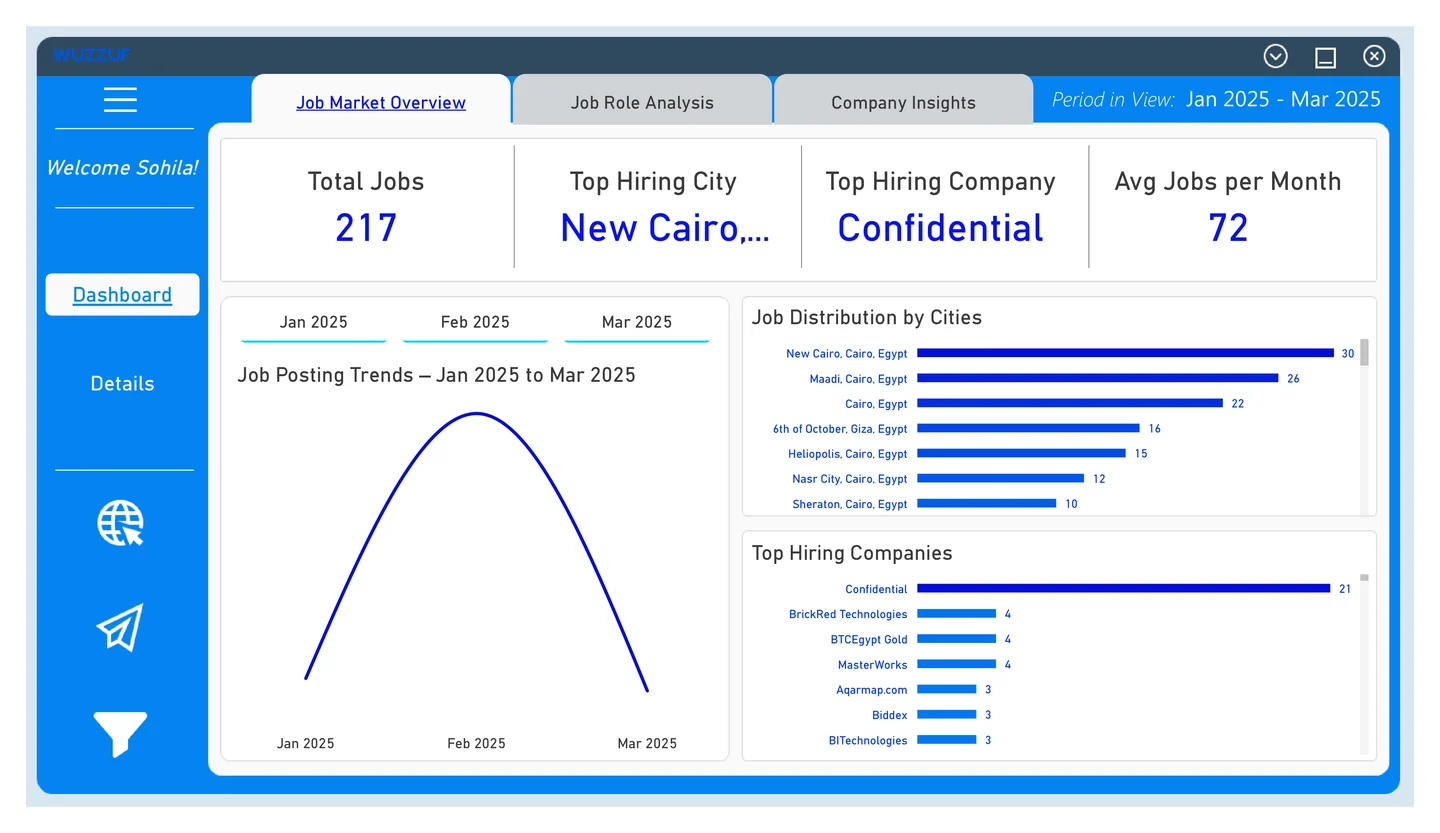
Explore job trends, in-demand roles, skills, and hiring companies from Wuzzuf.
 Explore report
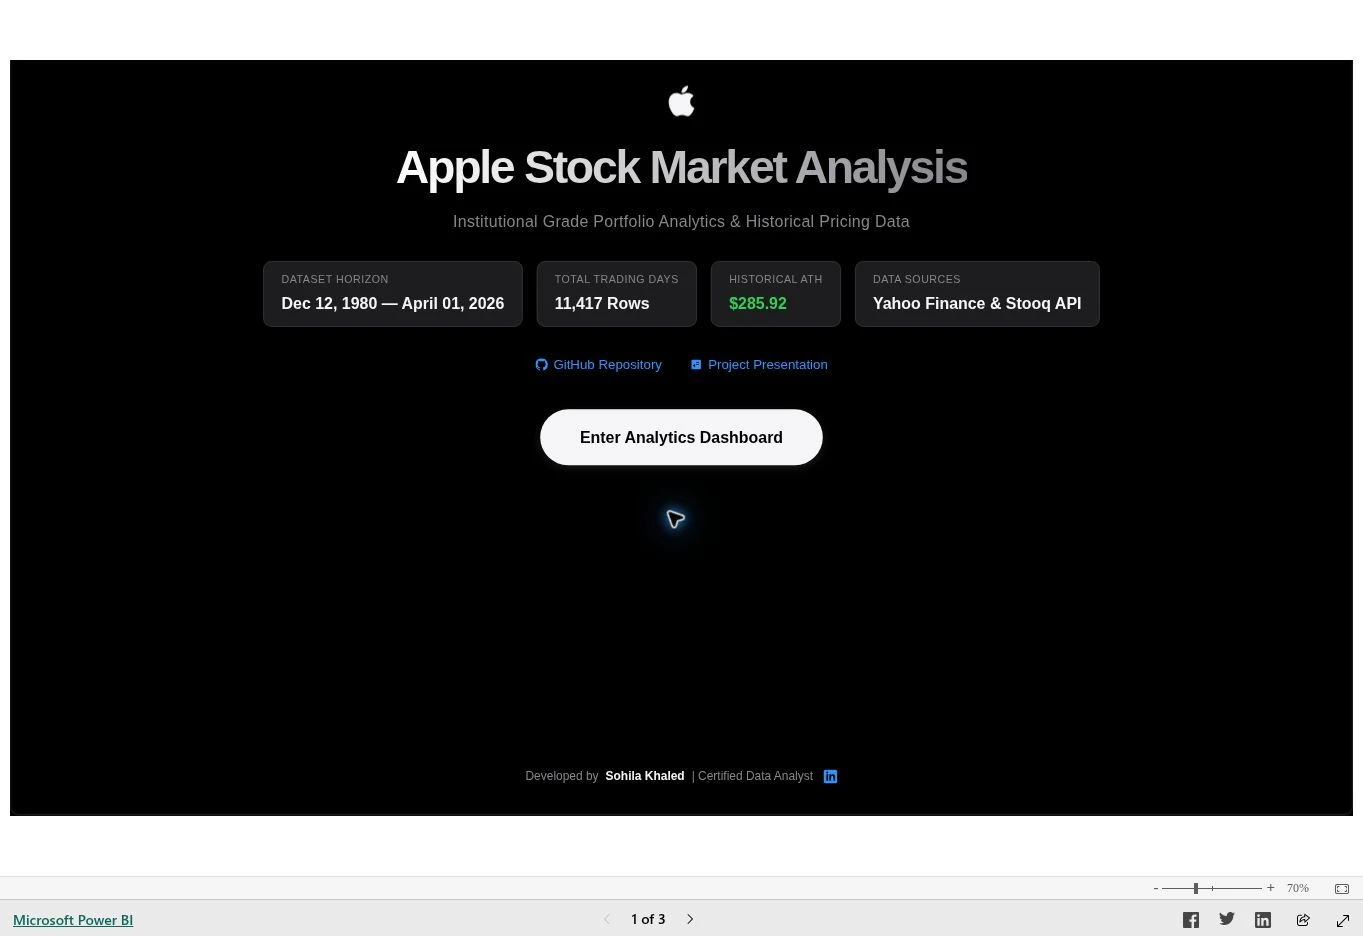
A historical AAPL analysis connecting Python, market data, MySQL, and Power BI.
 Explore report
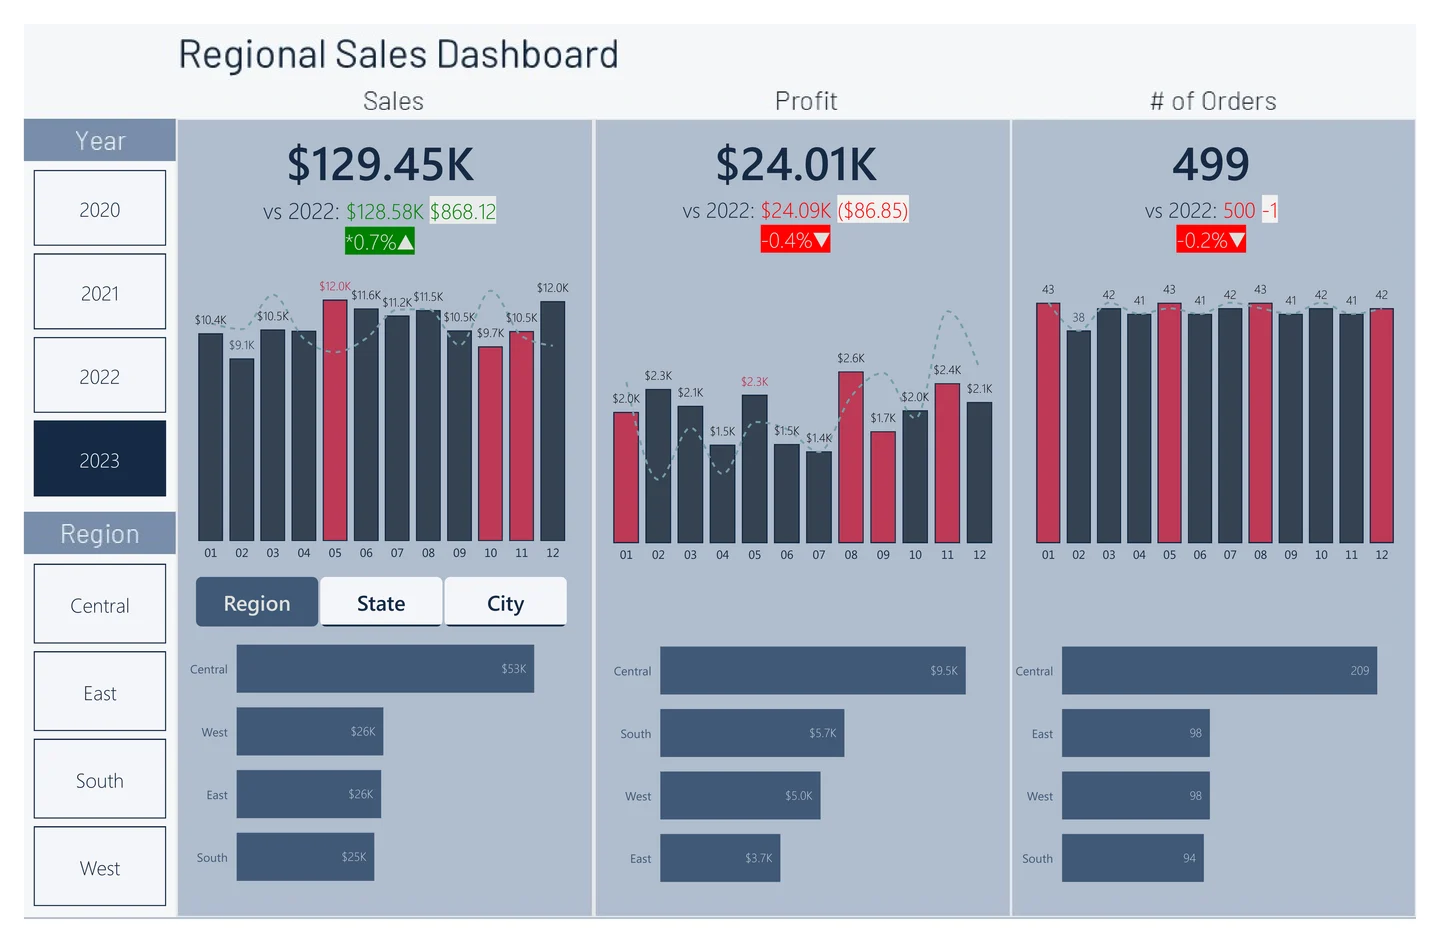
A regional view of sales, profit, order trends, and geographic performance.
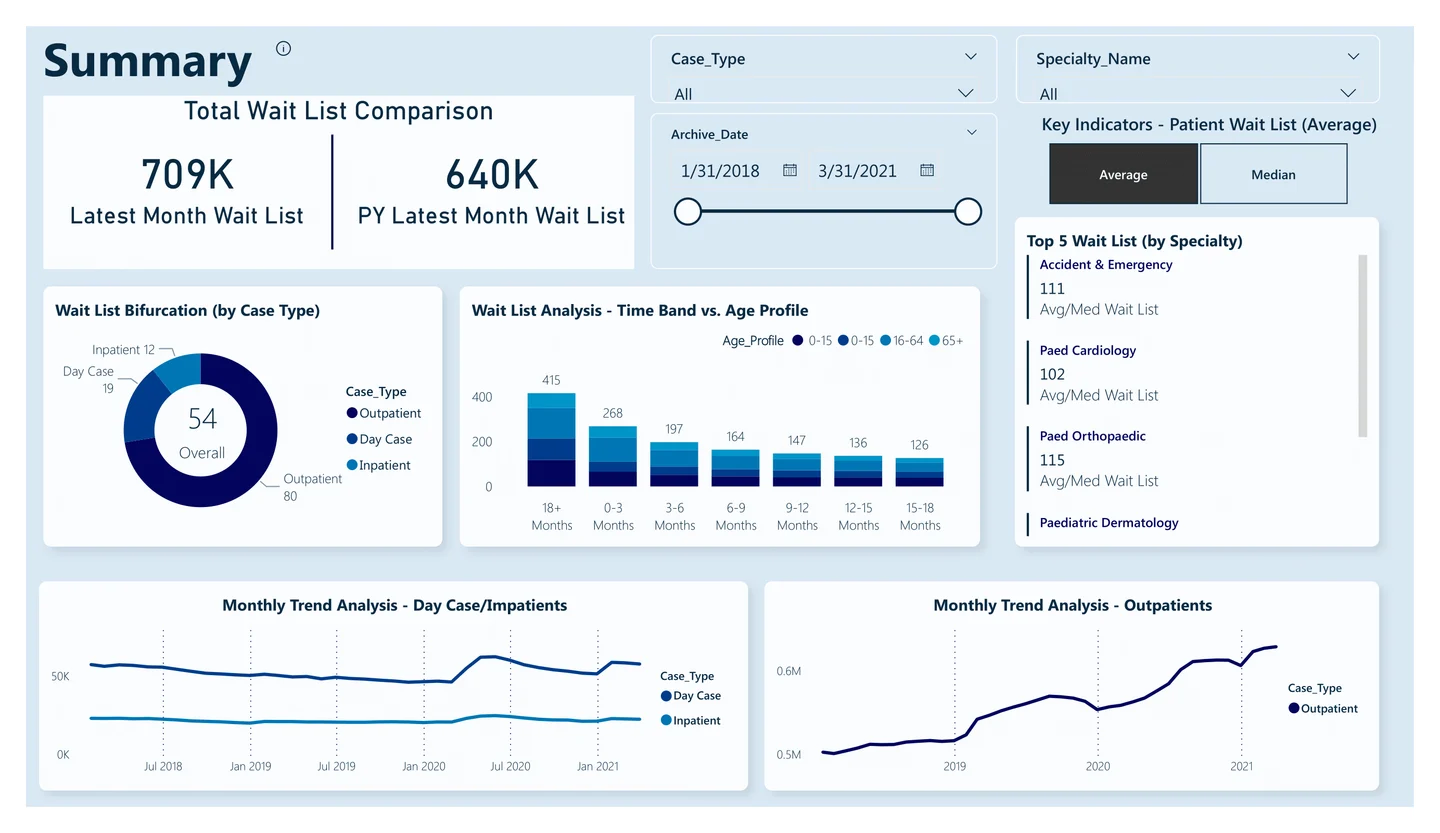 Explore report
Patient visits, operational trends, and a detailed view of healthcare activity.
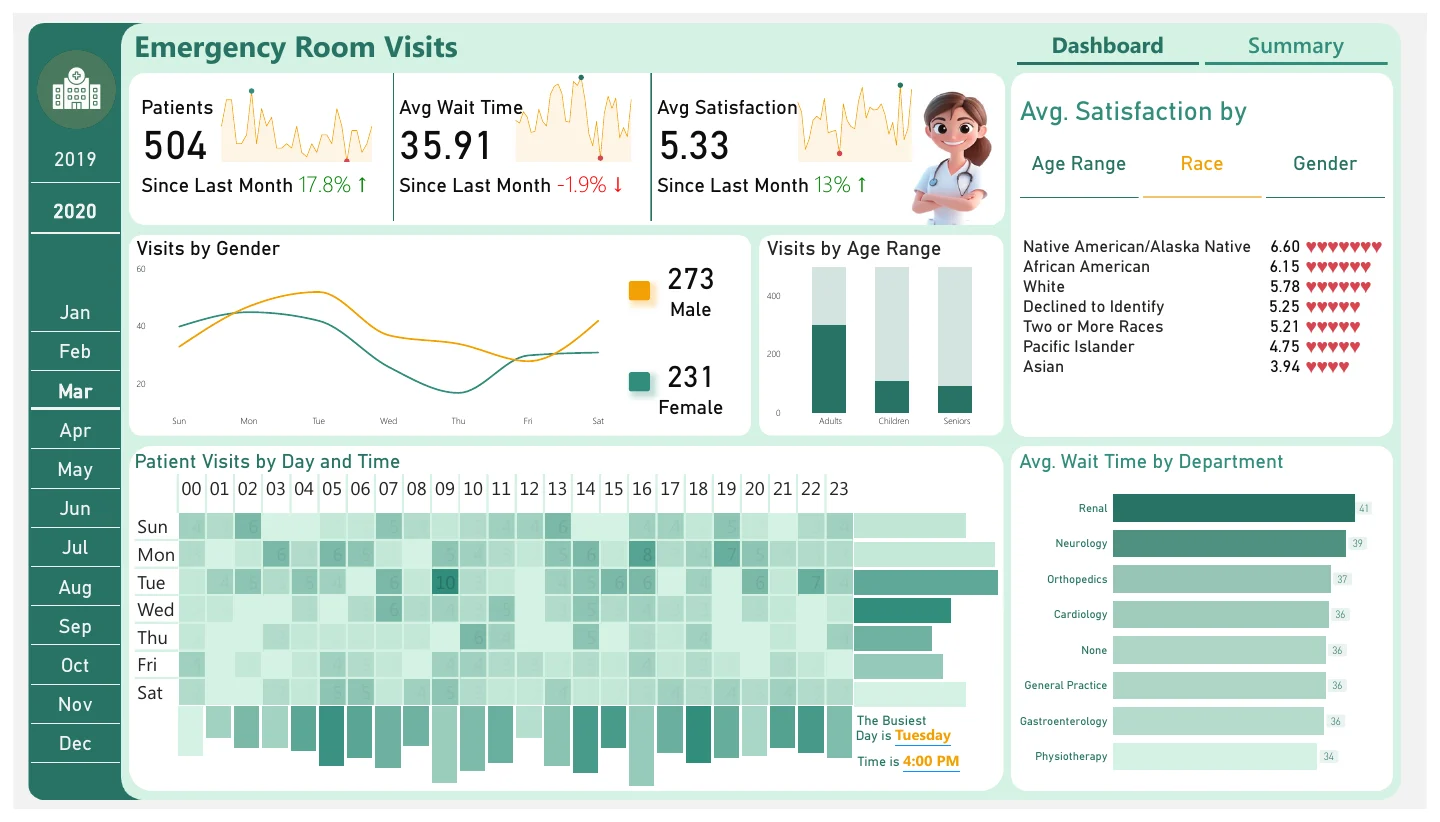 Explore report
Patient flow, wait times, satisfaction, and emergency-room activity.
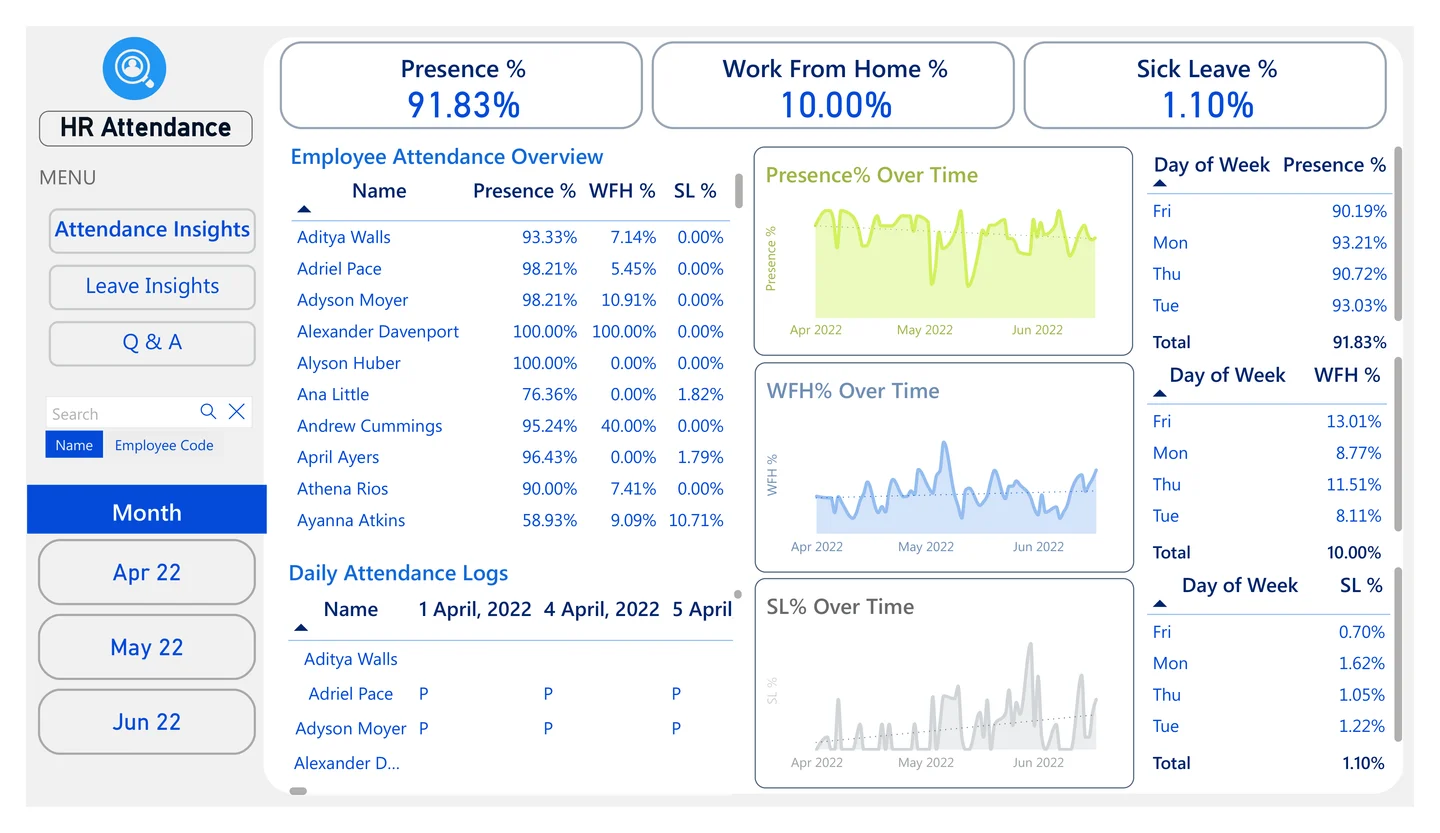 Explore report
Attendance patterns and leave insights, with a shared Power BI report link.
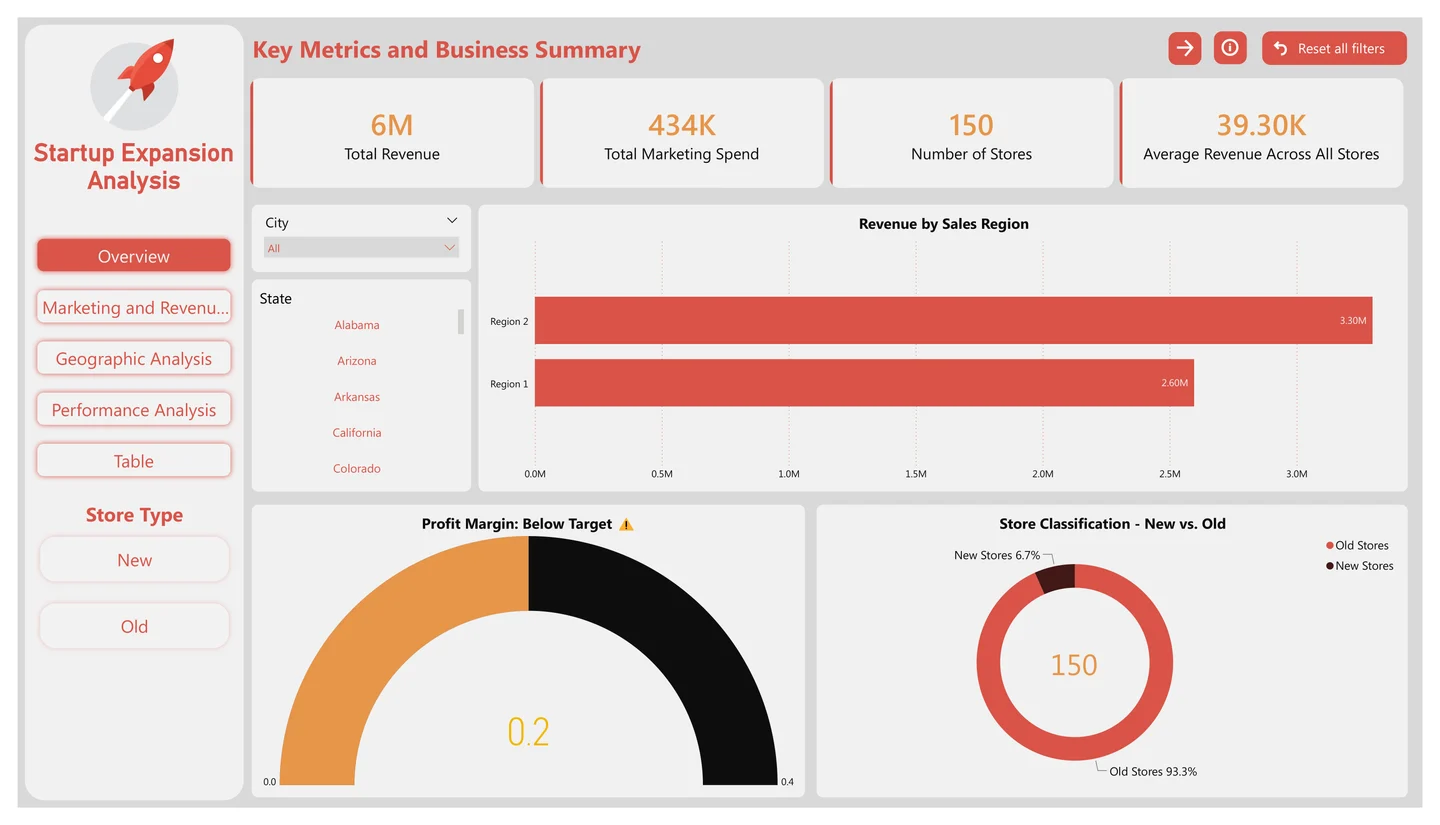 Explore report
Revenue, marketing spend, and location performance for an expansion scenario.
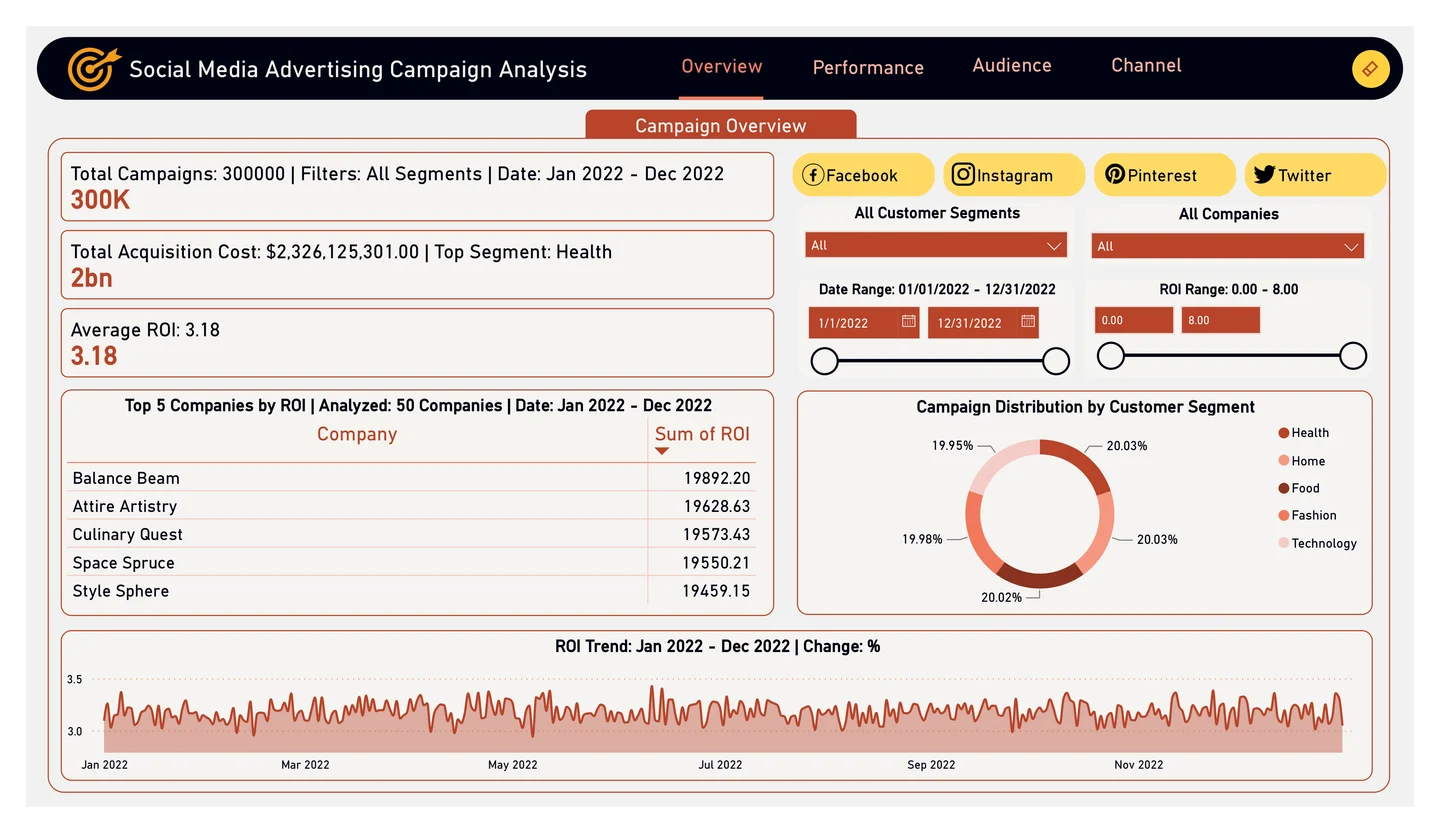 Explore report
Campaign, channel, audience, and advertising performance in one reporting project.
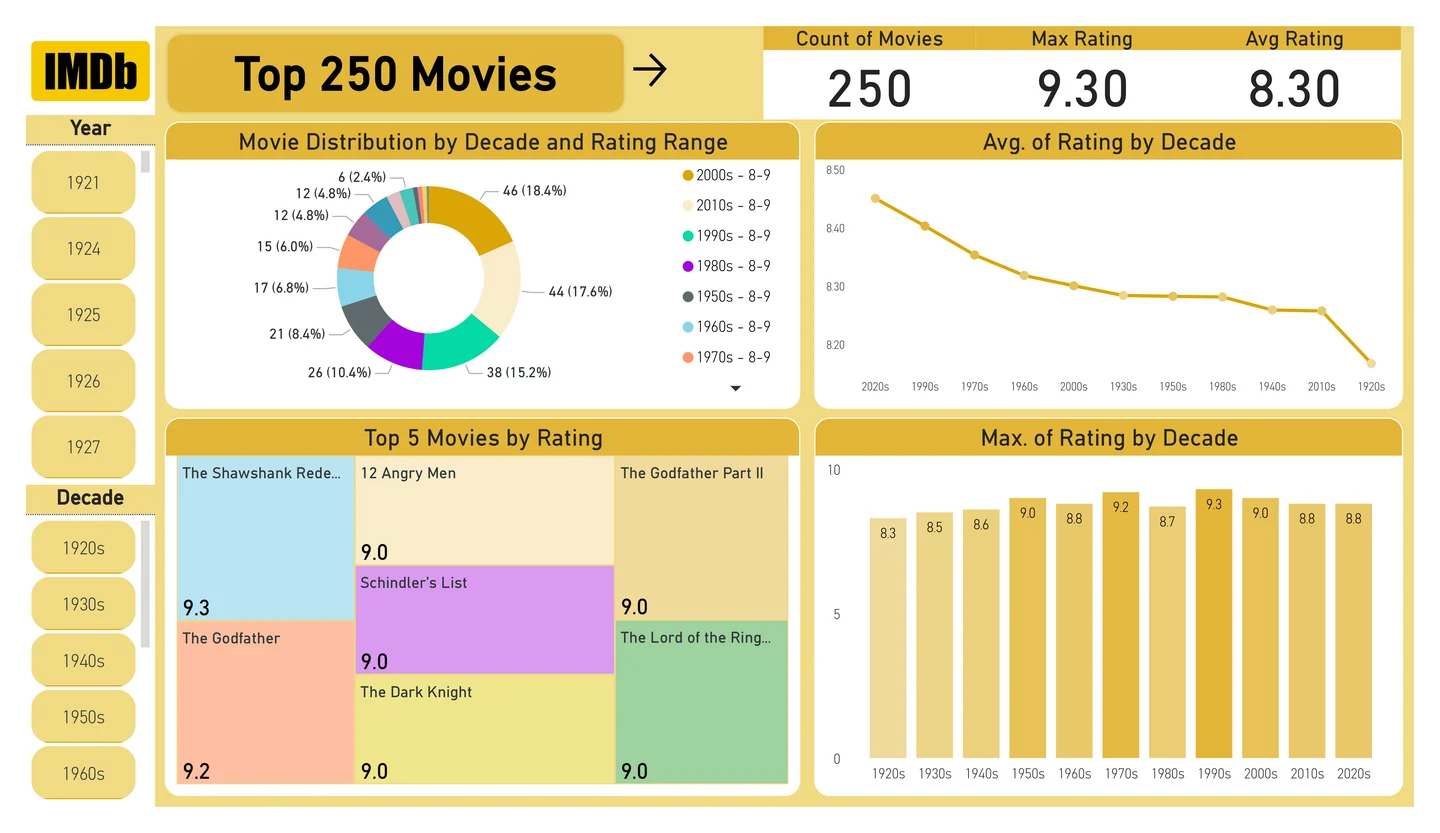 Explore report
Explore movie ratings, genres, release years, and the IMDb Top 250 collection.
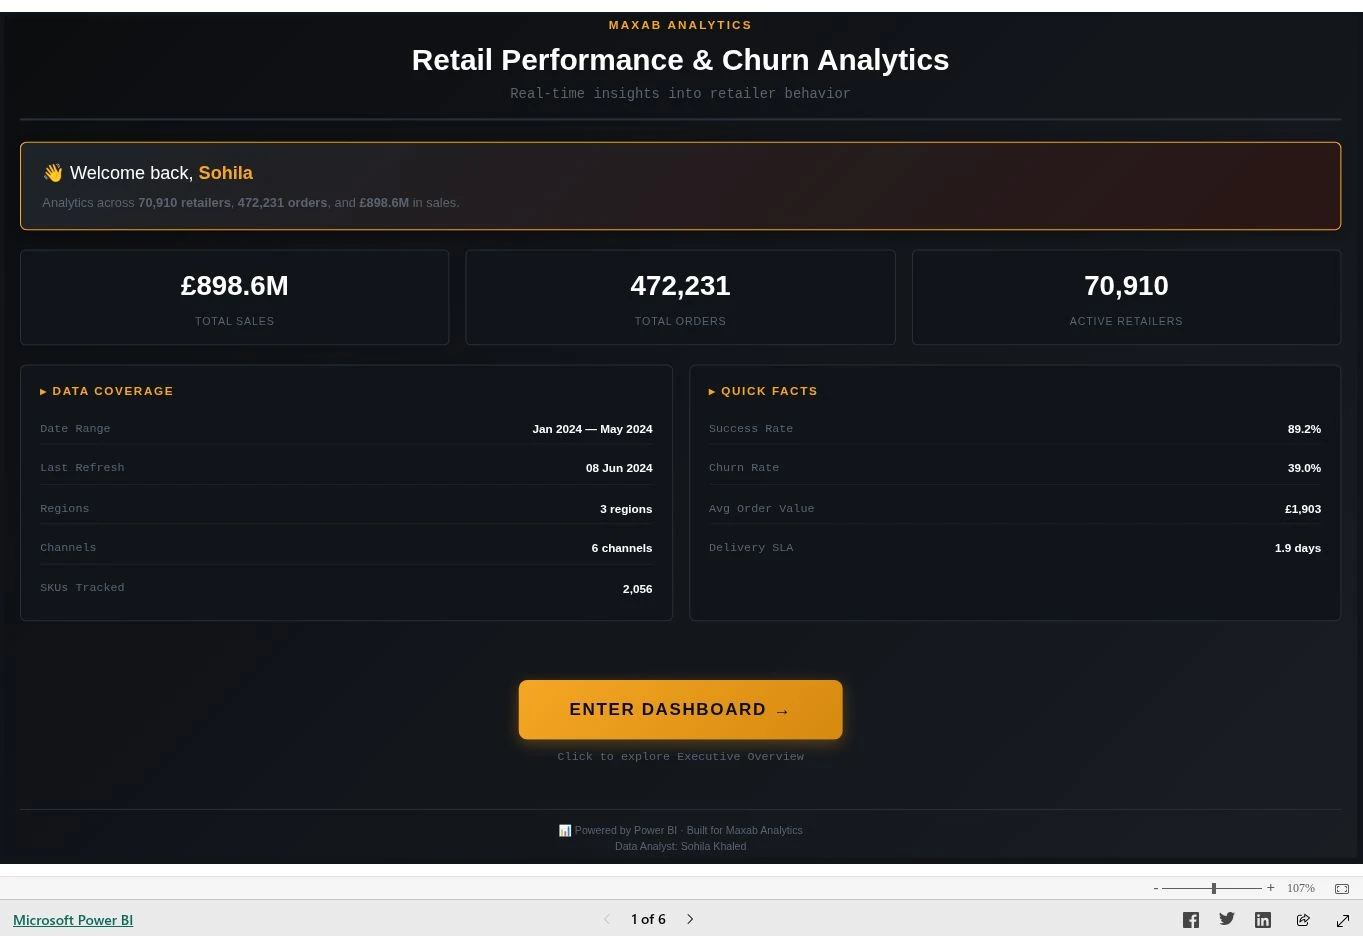 Explore report
An Egyptian B2B portfolio scenario exploring sales, churn, delivery, and commercial metrics.
 Explore the report projectPower BI Desktop · repository filesExplore report
An API-to-report workflow for economic indicators, with a Power BI report file.
Explore the report projectPower BI Desktop · repository filesExplore report Explore the report projectPower BI Desktop · repository filesExplore report A Power BI project exploring the connection between sales and operations planning.
Explore the report projectPower BI Desktop · repository filesExplore report Campaign reporting files, reusable report components, and a documented analytics workflow.
Explore the report projectPower BI Desktop · repository filesExplore report A streaming analytics project with version-controlled Power BI report definitions.
Explore the report projectPower BI Desktop · repository filesExplore report Multi-format ingestion, dimensional modeling, and a version-controlled Power BI project.
Explore the report projectPower BI Desktop · repository filesExplore report Campaign snapshots, data grains, and an analytics model with Power BI project files.
Explore the report projectPower BI Desktop · repository filesExplore report A multi-source HR portfolio scenario with Kimball modeling and Power BI project files.
Explore the report projectPower BI Desktop · repository filesExplore report A local-market data platform with a version-controlled Power BI reporting project.
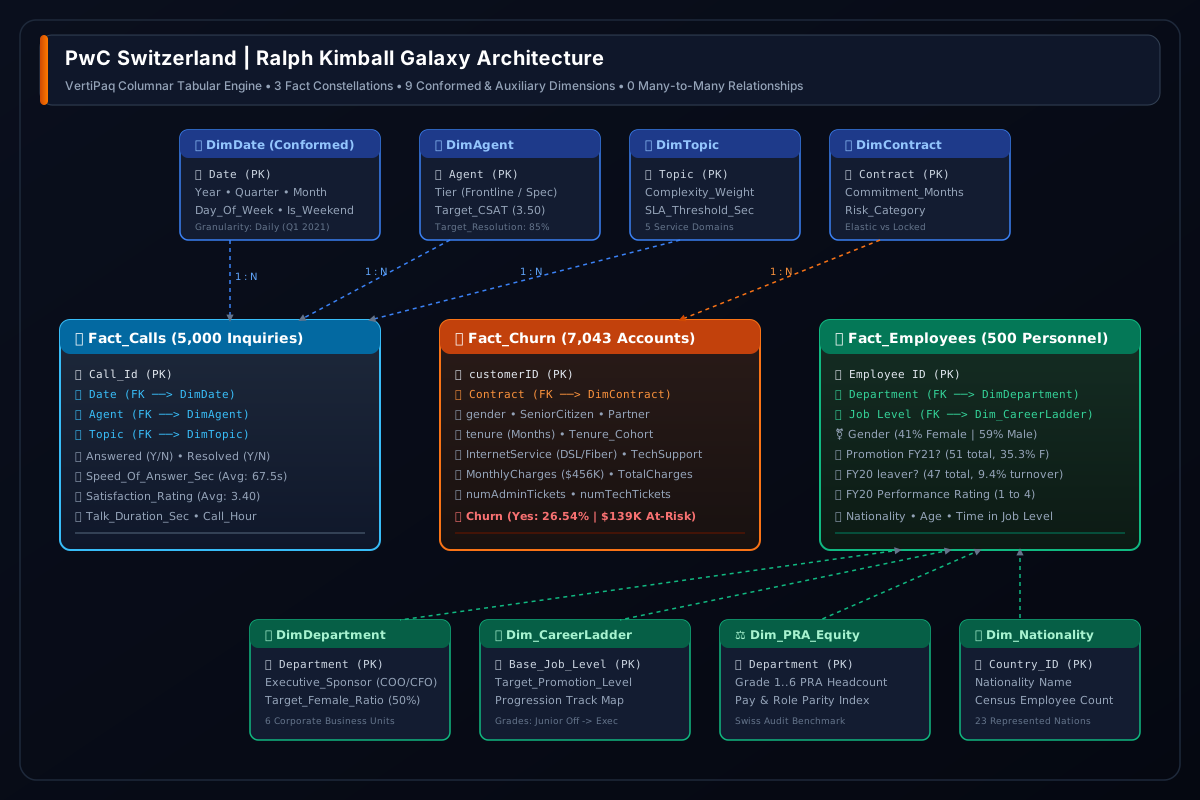 Explore report
Original GitHub README diagrams covering the galaxy semantic model, Power Query ETL, executive KPIs, and workforce progression in the Forage virtual case.
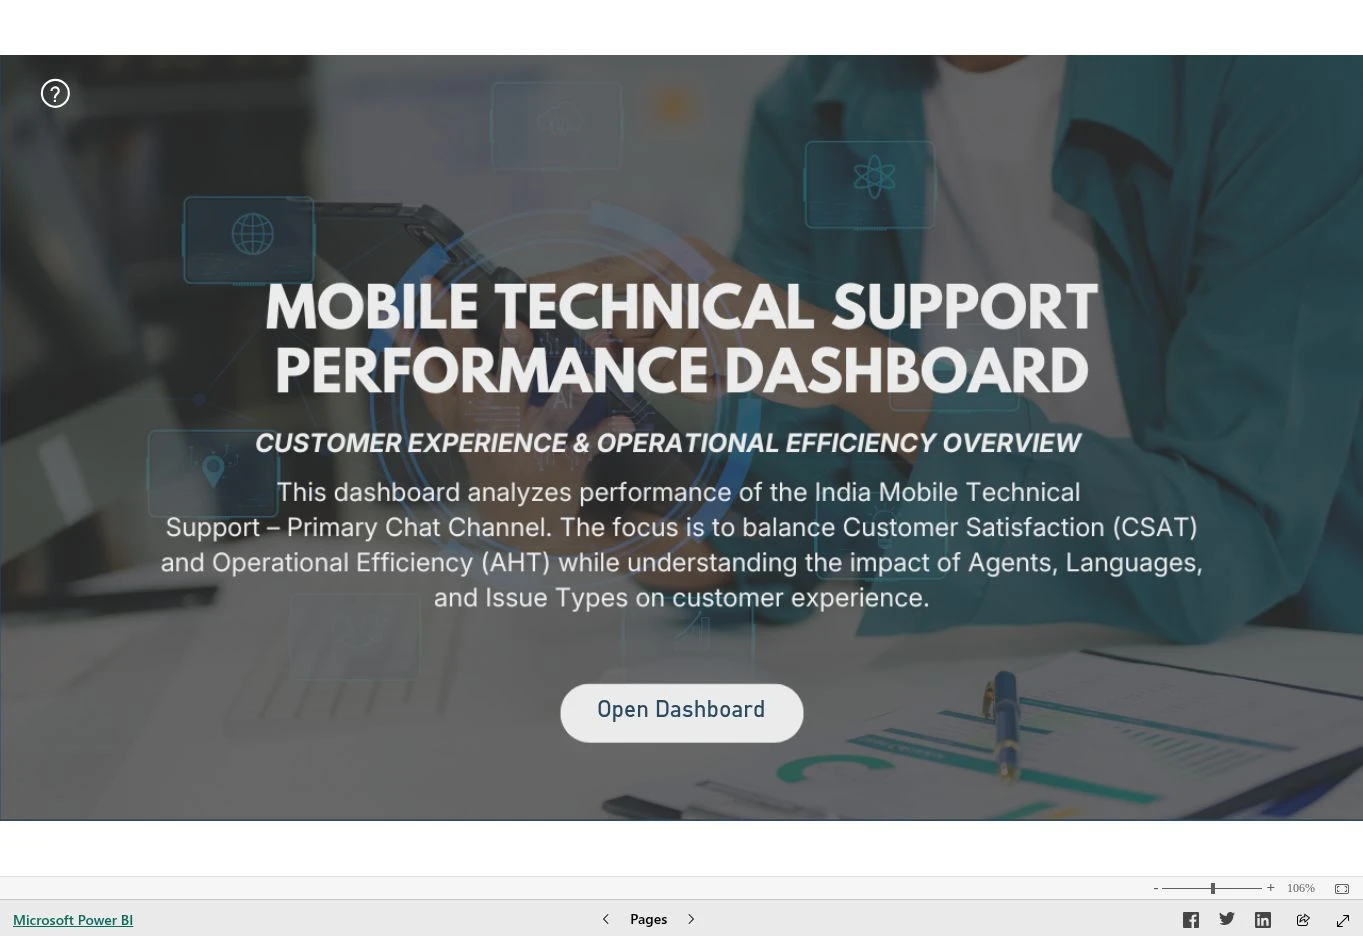 Explore report
A Power BI decision-support project exploring customer satisfaction, average handle time, agent performance, and support queues.
Try another name or show the full collection.
Previews and report links come from my public repositories and previous portfolio. Some reports are available as Power BI Desktop project files. A Power BI sign-in link is labeled separately. Screenshots show saved report views; architecture diagrams are labeled separately.