Mobile Technical Support Analytics
A Power BI decision-support project exploring customer satisfaction, average handle time, agent performance, and support queues.
A question. A process.
Work you can explore.
Move from the project’s purpose to its available previews and source files.
Chapter 1 of 4 · The question
What this project explores.
A Power BI decision-support project exploring customer satisfaction, average handle time, agent performance, and support queues.
Follow the implementation.
The repository documents Mobile Technical Support Analytics. Start with the README and follow its setup and implementation files; the source collection below gives you a way into the work.
Read the implementation notesSee the work. Inspect the details.
A Power BI decision-support project exploring customer satisfaction, average handle time, agent performance, and support queues.
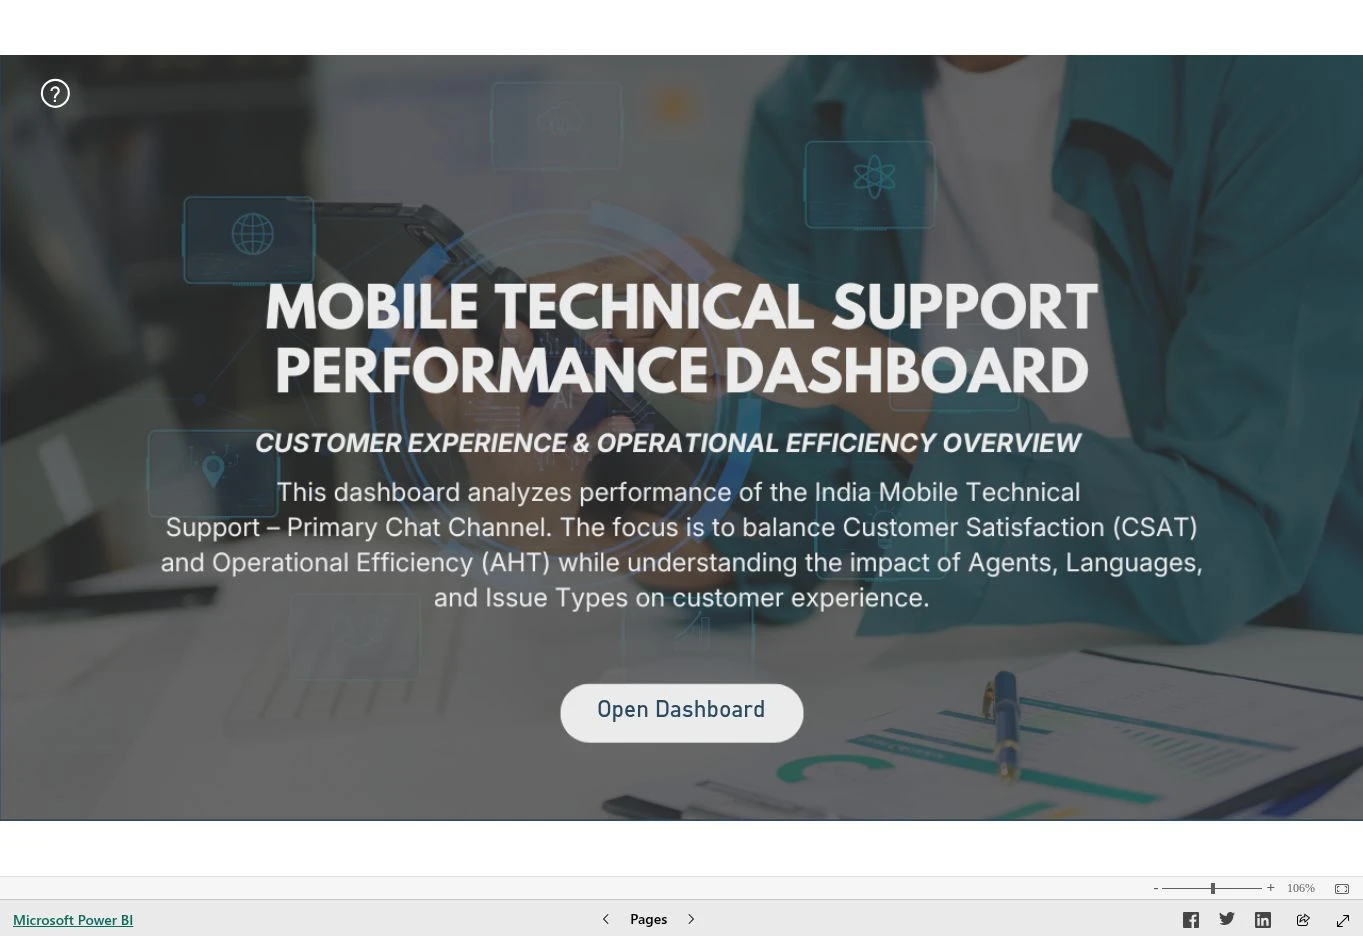
Published Power BI home view · Captured from the published Power BI report. Select to enlarge.

Go beyond
the screenshot.
Load the public Power BI report to explore its pages and filters. The interactive view connects to Microsoft Power BI when you choose to load it.
Choose where to look deeper.
No source files are linked in the current inventory. The original project entry is the available reference.