Emergency Room Visits
Patient flow, wait times, satisfaction, and emergency-room activity.
A question. A process.
Work you can explore.
Move from the project’s purpose to its available previews and source files.
Chapter 1 of 4 · The question
What this project explores.
Power BI dashboard analyzing emergency room data to improve decision-making. Features advanced DAX measures, insights into patient satisfaction, visit trends, and demographics. Includes interactive design with slicers and drill-throughs. Inspired by Abdelytics and Wecare designs, with PBIX, CSV, and documentation files.
Follow the implementation.
- 01
Designed a star schema data model linking patients, physicians, encounter details, and timestamps.
- 02
Created advanced DAX measures tracking time-to-triage, time-to-physician, total length of stay, and patient satisfaction ratings.
- 03
Built a dynamic executive summary containing interactive alerts for times exceeding target thresholds.
- 04
Developed drill-down paths from high-level monthly metrics down to individual physician shifts.
See the work. Inspect the details.
Patient flow, wait times, satisfaction, and emergency-room activity.
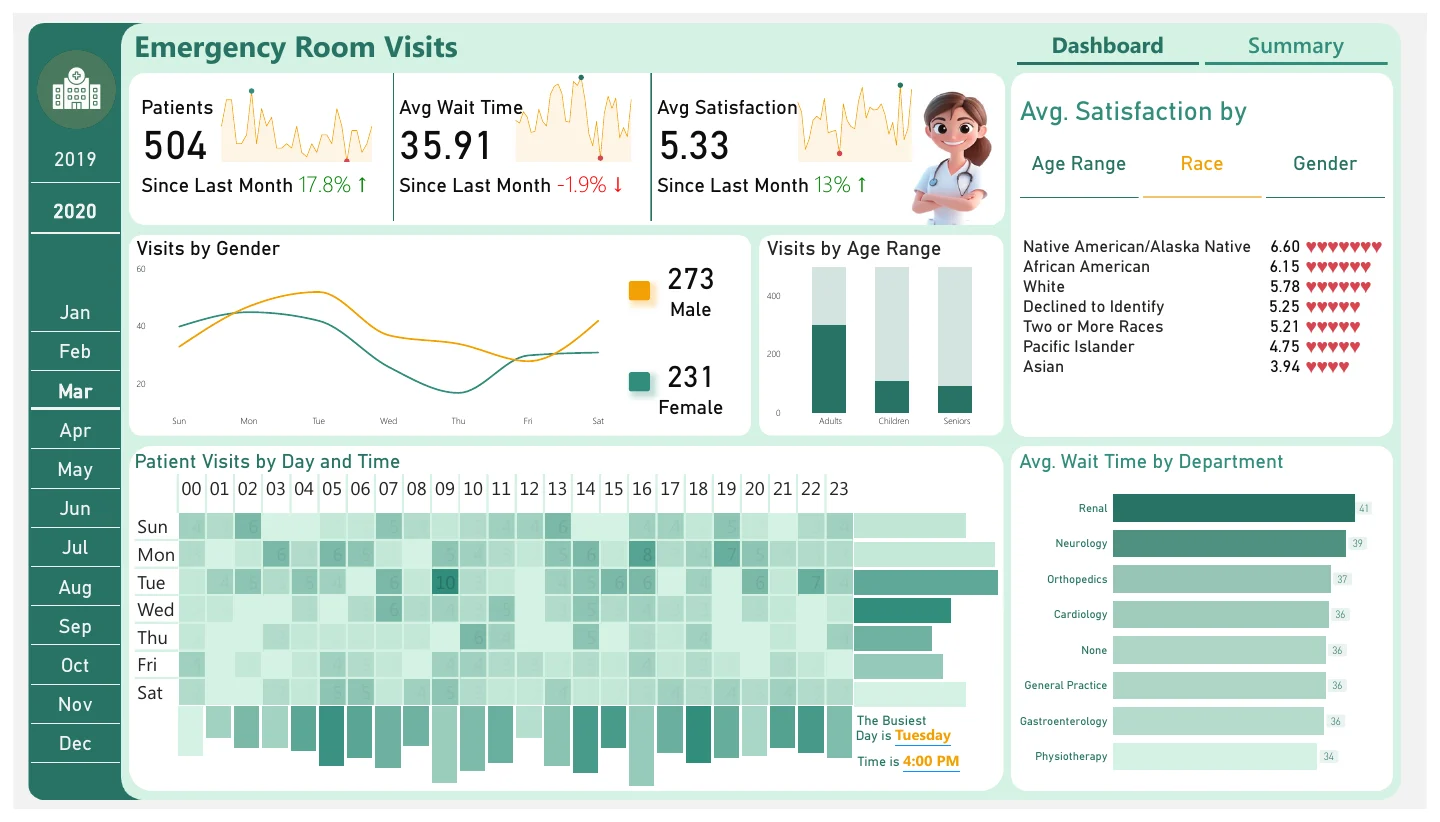
Emergency room dashboard — PDF export · Screenshot from the repository’s PDF export. Select to enlarge.

Go beyond
the screenshot.
Load the public Power BI report to explore its pages and filters. The interactive view connects to Microsoft Power BI when you choose to load it.
Choose where to look deeper.
Search the linked source inventory or narrow it to the kind of artifact you want to inspect. Files open at their original source.
4 linked source files
No linked files match this view.