Healthcare Analytics Dashboard
Interactive Power BI dashboard for analyzing hospital waitlists, patient demographics, and service trends.
A question. A process.
Work you can explore.
Move from the project’s purpose to its available previews and source files.
Chapter 1 of 4 · The question
What this project explores.
Interactive Power BI dashboard for analyzing hospital waitlists, patient demographics, and service trends.
Follow the implementation.
- 01
Constructed an analytical model integrating patient admission, triage level, physician specialty, and wait time records.
- 02
Built custom DAX metrics to track average wait times, patient throughput, and department utilization rates.
- 03
Implemented conditional formatting and alert mechanisms to highlight departments exceeding maximum wait-time thresholds.
- 04
Designed a clean, accessibility-compliant user interface suited for clinical administrators.
See the work. Inspect the details.
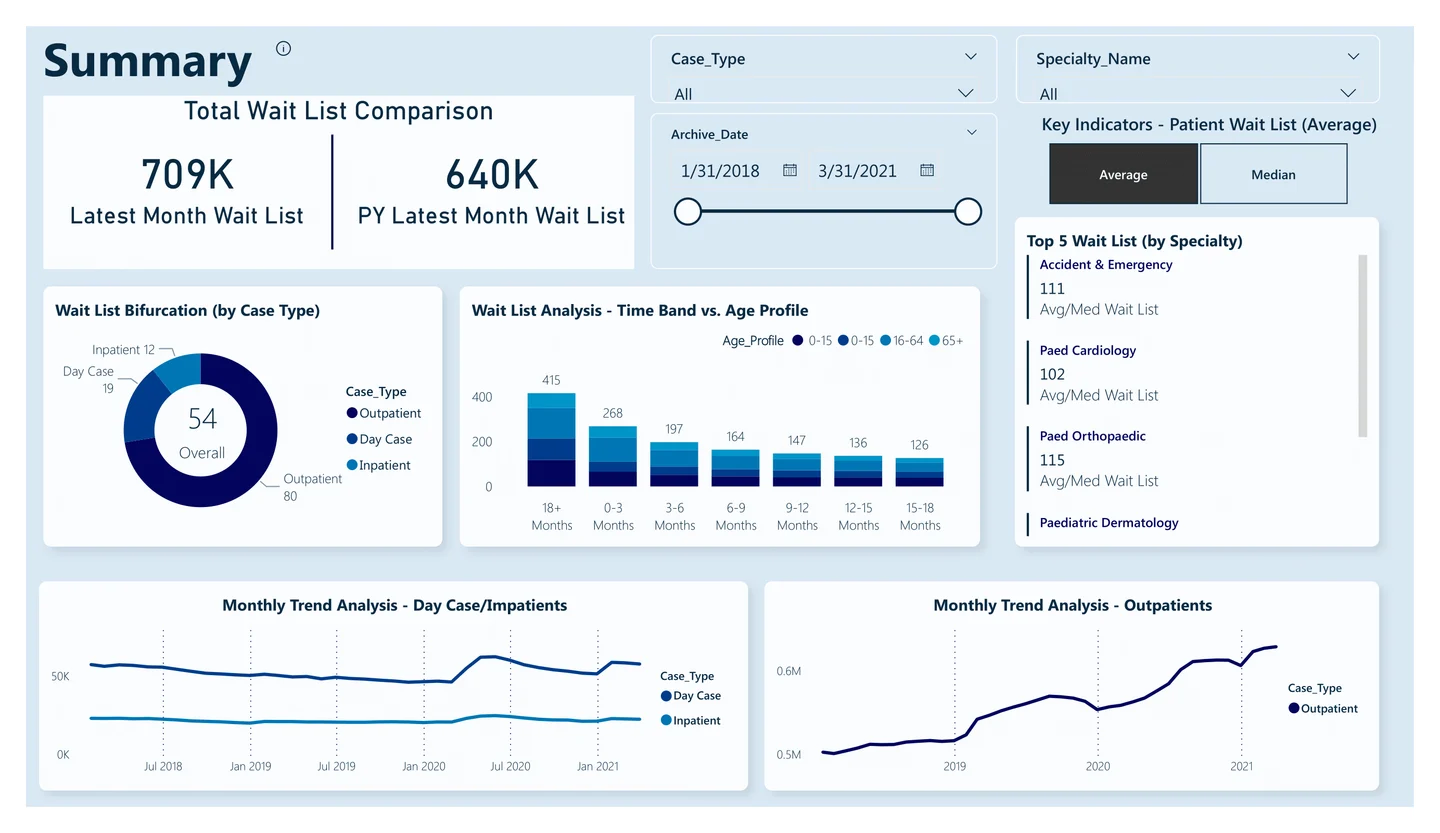
Patient visits, operational trends, and a detailed view of healthcare activity.
 Enlarge preview
Choose where to look deeper.
Search the linked source inventory or narrow it to the kind of artifact you want to inspect. Files open at their original source.
2 linked source files
No linked files match this view.
The source
keeps moving.
Source updated
Interactive Power BI dashboard for analyzing hospital waitlists, patient demographics, and service trends.
Current README excerpt
The Healthcare Analytics Dashboard is an interactive Power BI project designed to provide actionable insights into hospital operations. It focuses on analyzing inpatient and outpatient data over a span of four years (2018-2021), combined with specialty mapping to track resource utilization and patient trends.
A source excerpt, not an independently verified outcome.