B2B Retail Analytics & Churn Diagnostic
A Power BI portfolio exploring retailer lifecycle, delivery performance, sales changes, and category mix in a B2B grocery-distribution scenario.
A question. A process.
Work you can explore.
Follow the decisions behind the implementation, then inspect the original work.
Chapter 1 of 4 · The question
The question behind the build.
A sales drop can have several causes. Retention, delivery performance, and commercial mix need separate definitions and a shared reporting model.
Follow the implementation.
- 01
Use a star schema to organize the analytical entities and facts.
- 02
Build DAX measures for performance and period comparisons.
- 03
Explore delivery SLA, cohort retention, activation, and sales-drop decomposition.
- 04
Organize the reporting experience into executive, operations, retention, and commercial views.
See the work. Inspect the details.
Look at the model, DAX library, and reporting pages to understand how the business questions are decomposed. The repository connects customer lifecycle questions to operational context.
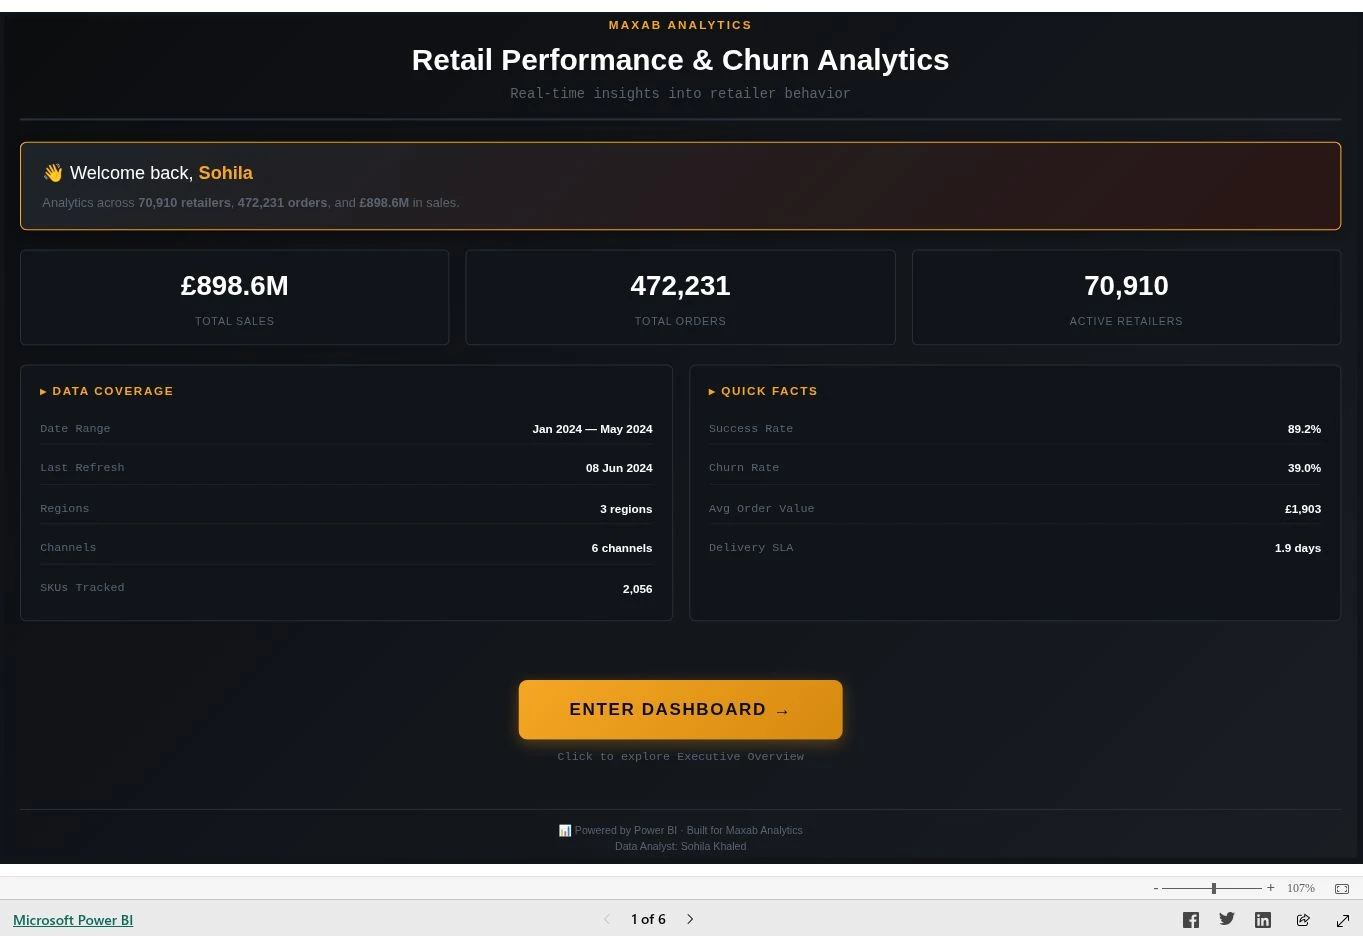 Enlarge preview
Choose where to look deeper.
Search the linked source inventory or narrow it to the kind of artifact you want to inspect. Files open at their original source.
7 linked source files
No linked files match this view.
The source
keeps moving.
Source updated
Real-time insights into retailer behavior, operational performance, and customer lifecycle across the Maxab distribution network in Egypt.
Current README excerpt
Real-time insights into retailer behavior, operational performance, and customer lifecycle across the Maxab distribution network in Egypt.
A source excerpt, not an independently verified outcome.