SMART Supply Chain Insights Dashboard
A supply-chain analysis project connecting Python exploration, Excel modeling, and Power BI reporting.
A question. A process.
Work you can explore.
Follow the decisions behind the implementation, then inspect the original work.
Chapter 1 of 4 · The question
The question behind the build.
Sales, fulfillment, shipping risk, and suspicious or cancelled orders need to be explored together to understand operational patterns.
Follow the implementation.
- 01
Clean and explore the supplied transaction dataset with Python.
- 02
Investigate distributions, sales and profit trends, and order-status patterns.
- 03
Develop a star-schema model and relationships.
- 04
Build Power BI views using DAX and interactive reporting.
See the work. Inspect the details.
Follow the repository from raw data and EDA to model design and report artifacts. It shows the analytical work behind an operations dashboard.
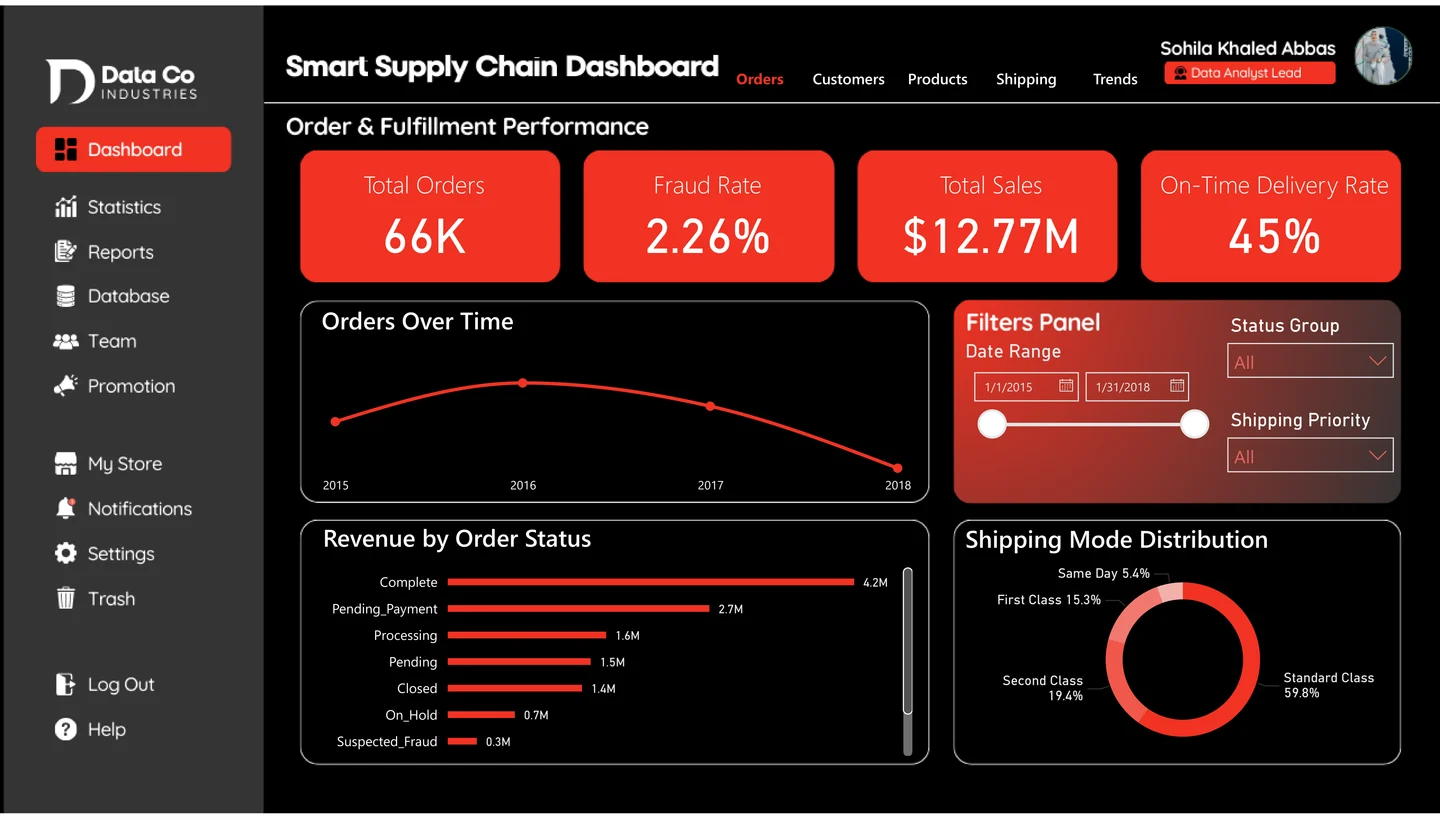 Enlarge preview
Choose where to look deeper.
Search the linked source inventory or narrow it to the kind of artifact you want to inspect. Files open at their original source.
3 linked source files
No linked files match this view.
The source
keeps moving.
Source updated
A comprehensive end-to-end data analytics project using Python, Excel, and Power BI to extract actionable insights from complex supply chain data. This dashboard supports operational and strategic decision-making by visualizing key KPIs in logistics, fulfillment, sales, and fraud detection.
Current README excerpt
A comprehensive end-to-end data analytics project using Python, Excel, and Power BI to extract actionable insights from complex supply chain data. This dashboard supports operational and strategic decision-making by visualizing key KPIs in logistics, fulfillment, sales, and fraud detection.
A source excerpt, not an independently verified outcome.