Regional Sales Dashboard
Power BI dashboard for analyzing regional sales trends, identifying growth opportunities, and increasing profitability by 20% using actionable insights.
A question. A process.
Work you can explore.
Move from the project’s purpose to its available previews and source files.
Chapter 1 of 4 · The question
What this project explores.
Power BI dashboard for analyzing regional sales trends, identifying growth opportunities, and increasing profitability by 20% using actionable insights.
Follow the implementation.
- 01
Consolidated daily transaction files from regional branches into a centralized data warehouse schema.
- 02
Built a Power BI data model with relationships between products, customers, geography, and sales reps.
- 03
Created DAX measures to calculate total revenue, profit margins, sales variance against targets, and rolling quarterly growth.
- 04
Designed interactive geospatial maps and performance ranking leaderboards.
See the work. Inspect the details.
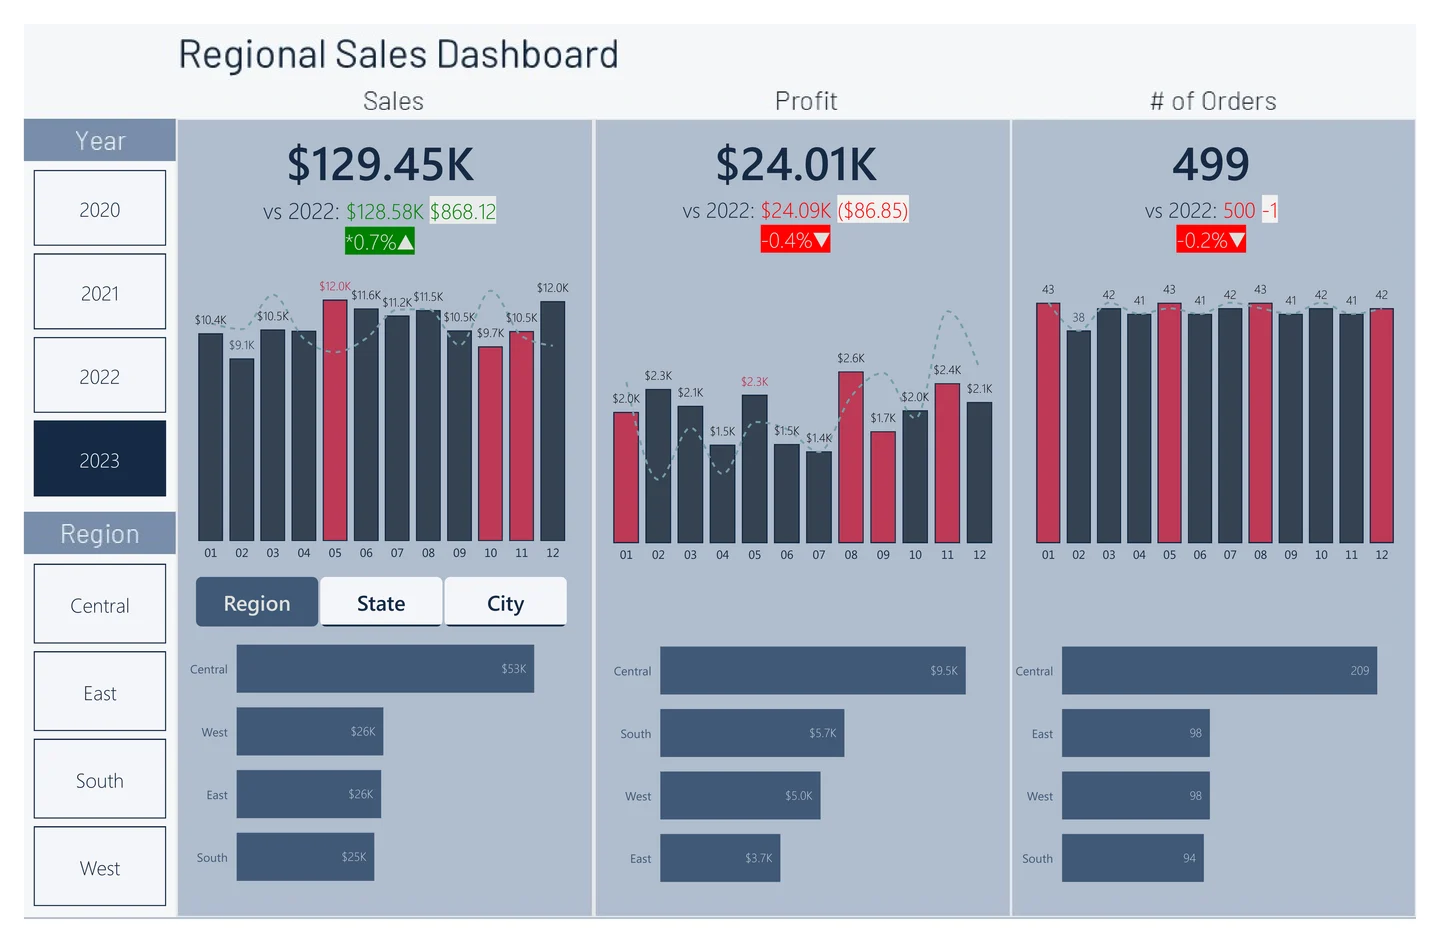
A regional view of sales, profit, order trends, and geographic performance.
 Enlarge preview
Choose where to look deeper.
Search the linked source inventory or narrow it to the kind of artifact you want to inspect. Files open at their original source.
6 linked source files
No linked files match this view.
The source
keeps moving.
Source updated
Power BI dashboard for analyzing regional sales trends, identifying growth opportunities, and increasing profitability by 20% using actionable insights.
Current README excerpt
The Regional Sales Dashboard is a dynamic and interactive data visualization project developed using Power BI. This dashboard provides actionable insights into Sales, Profit, and Number of Orders across different regions and timeframes. It helps businesses identify trends, measure performance, and make data-driven decisions.
A source excerpt, not an independently verified outcome.