Startup Expansion Analysis Dashboard
This project integrates Python and Power BI to analyze a startup's store expansion performance. It features a 5-page interactive dashboard covering revenue, ROI, marketing efficiency, and detailed store-level insights. Includes data, visuals, and a full PDF report.
A question. A process.
Work you can explore.
Move from the project’s purpose to its available previews and source files.
Chapter 1 of 4 · The question
What this project explores.
This project integrates Python and Power BI to analyze a startup's store expansion performance. It features a 5-page interactive dashboard covering revenue, ROI, marketing efficiency, and detailed store-level insights. Includes data, visuals, and a full PDF report.
Follow the implementation.
- 01
Aggregated demographic, sales, and regional market saturation datasets using Python.
- 02
Engineered a dimensional model in Power BI with tables for regions, products, and customer segments.
- 03
Built DAX formulas to calculate running totals, regional market penetration indexes, and customer lifetime value (LTV) versus acquisition costs.
- 04
Visualized geographic performance using interactive map charts and forecasting models.
See the work. Inspect the details.
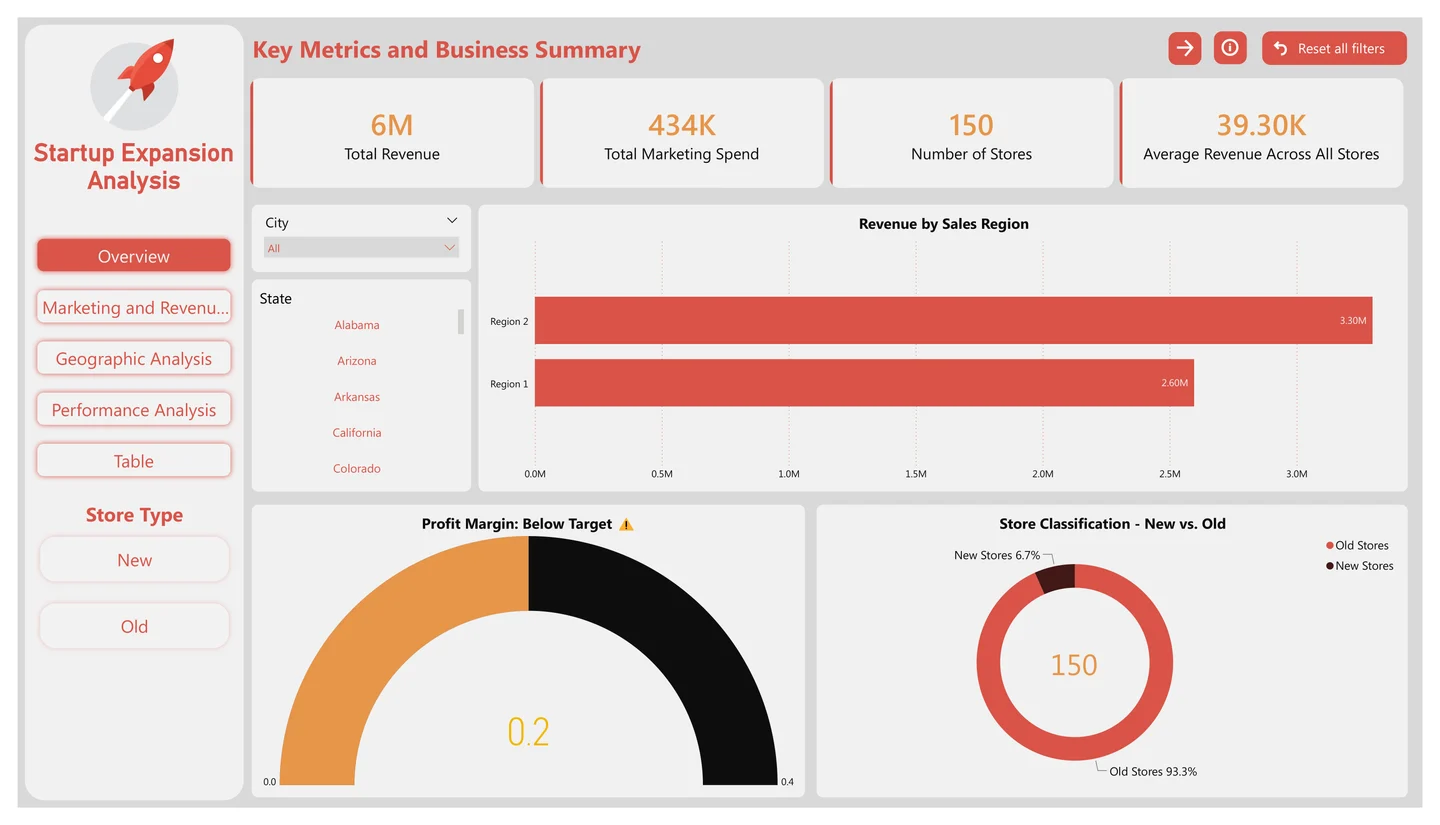
Revenue, marketing spend, and location performance for an expansion scenario.
 Enlarge preview
Choose where to look deeper.
Search the linked source inventory or narrow it to the kind of artifact you want to inspect. Files open at their original source.
4 linked source files
No linked files match this view.
The source
keeps moving.
Source updated
This project integrates Python and Power BI to analyze a startup's store expansion performance. It features a 5-page interactive dashboard covering revenue, ROI, marketing efficiency, and detailed store-level insights. Includes data, visuals, and a full PDF report.
Current README excerpt
This project analyzes the performance of a startup's store expansion across regions in the United States. Using Python & Power BI, the dashboard provides key insights into revenue, marketing efficiency, and store performance.
A source excerpt, not an independently verified outcome.