Social Media Advertising Dashboard
Delivered a dashboard resolving ROI data issues and highlighting a 35% click contribution from top channels.
A question. A process.
Work you can explore.
Move from the project’s purpose to its available previews and source files.
Chapter 1 of 4 · The question
What this project explores.
Delivered a dashboard resolving ROI data issues and highlighting a 35% click contribution from top channels.
Follow the implementation.
- 01
Utilized Python scripts to pull daily marketing campaign data from multiple social media platforms via APIs.
- 02
Cleaned and normalized campaign names, spending metrics, impressions, clicks, and conversions across platforms.
- 03
Designed a multi-channel attribution model in Power BI, writing DAX measures for Cost Per Click (CPC), Customer Acquisition Cost (CAC), and Return on Ad Spend (ROAS).
- 04
Created visual comparison views allowing direct side-by-side performance analysis of campaigns.
See the work. Inspect the details.
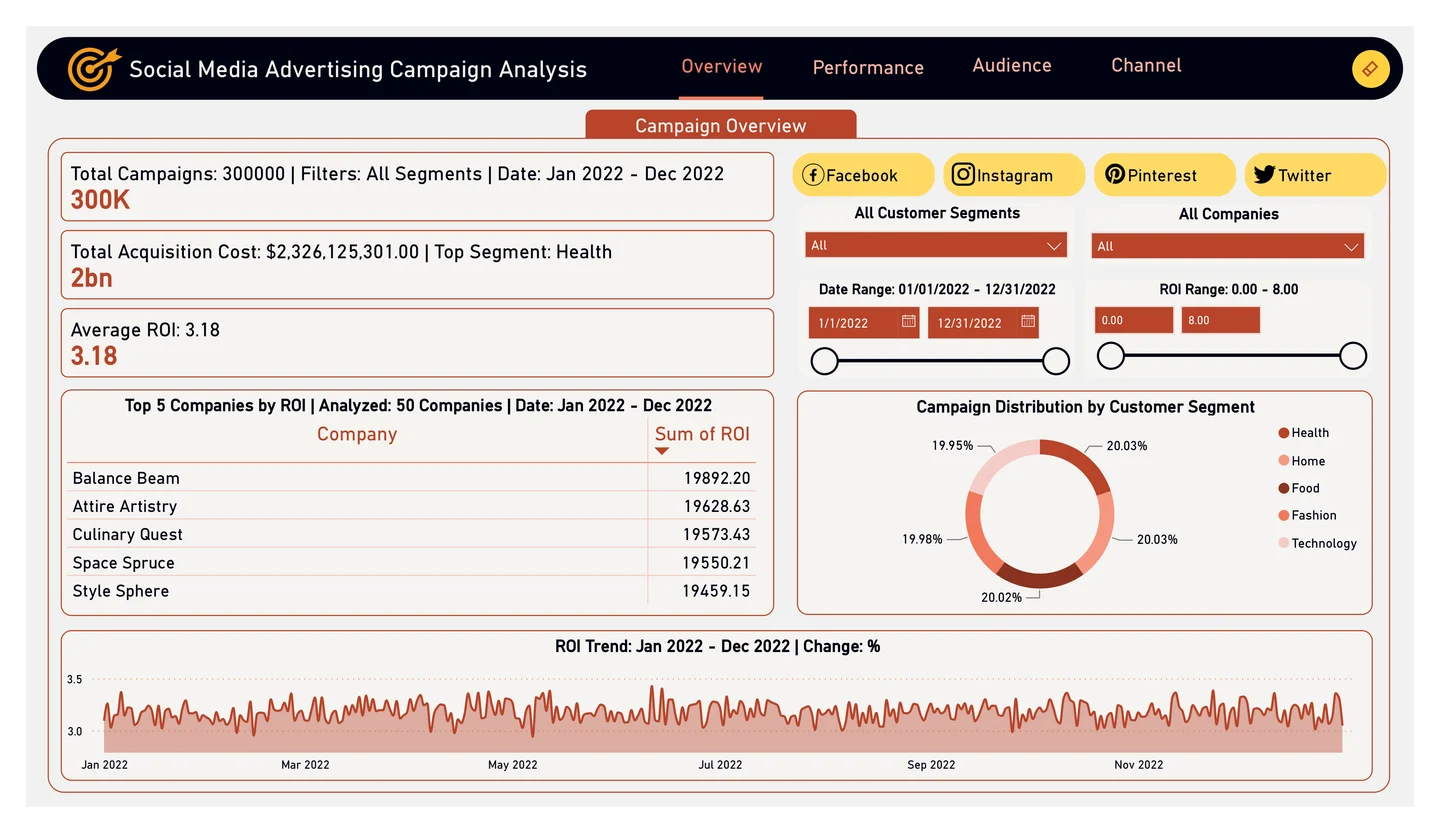
Campaign, channel, audience, and advertising performance in one reporting project.
 Enlarge preview
Choose where to look deeper.
Search the linked source inventory or narrow it to the kind of artifact you want to inspect. Files open at their original source.
3 linked source files
No linked files match this view.
The source
keeps moving.
Source updated
See the current repository documentation.
Current README excerpt
This repository contains a comprehensive Power BI dashboard for analyzing social media advertising campaigns. It includes data cleaning with Python, exploratory visualizations, and a multi-page Power BI dashboard focusing on campaign performance, audience engagement, and channel effectiveness. The dashboard is designed to analyze campaign performance, audience engagement, and channel effectiveness based on data from January 2022 to December 2022. It provides actionable insights for marketers, analysts, and decision-makers to optimize advertisin
A source excerpt, not an independently verified outcome.